Unlocking the Power of NetSuite Reporting

Sophie Lowe
May 08, 2025
NetSuite is packed with powerful reporting tools – but with so many options, it’s easy to overlook some of the features that could transform the way your business views and uses data. Whether you’re a long-time user, just getting started, or evaluating NetSuite as your next ERP, understanding these tools can help you uncover insights, improve efficiency, and drive smarter decision-making.
Why NetSuite Reporting Matters
Data is one of your most valuable assets – but it’s only useful when it can be accessed, understood, and acted upon. Effective reporting helps you:
- Track performance in real-time
- Identify trends and outliers
- Inform budgeting and forecasting
- Improve compliance and audit readiness
- Empower departments with self-serve analytics
With the right reporting tools, you can replace manual spreadsheets, reduce errors, and respond to changes faster.
In our recent webinar, we walked through the full spectrum of NetSuite’s reporting capabilities, from out-of-the-box features to advanced tools and third-party integrations. Here’s a deep dive into what’s available and how you can make the most of it.
Out-of-the-Box Reporting Tools
NetSuite provides a solid foundation of reporting functionality available to every customer, that may provide enough functionality for some businesses.
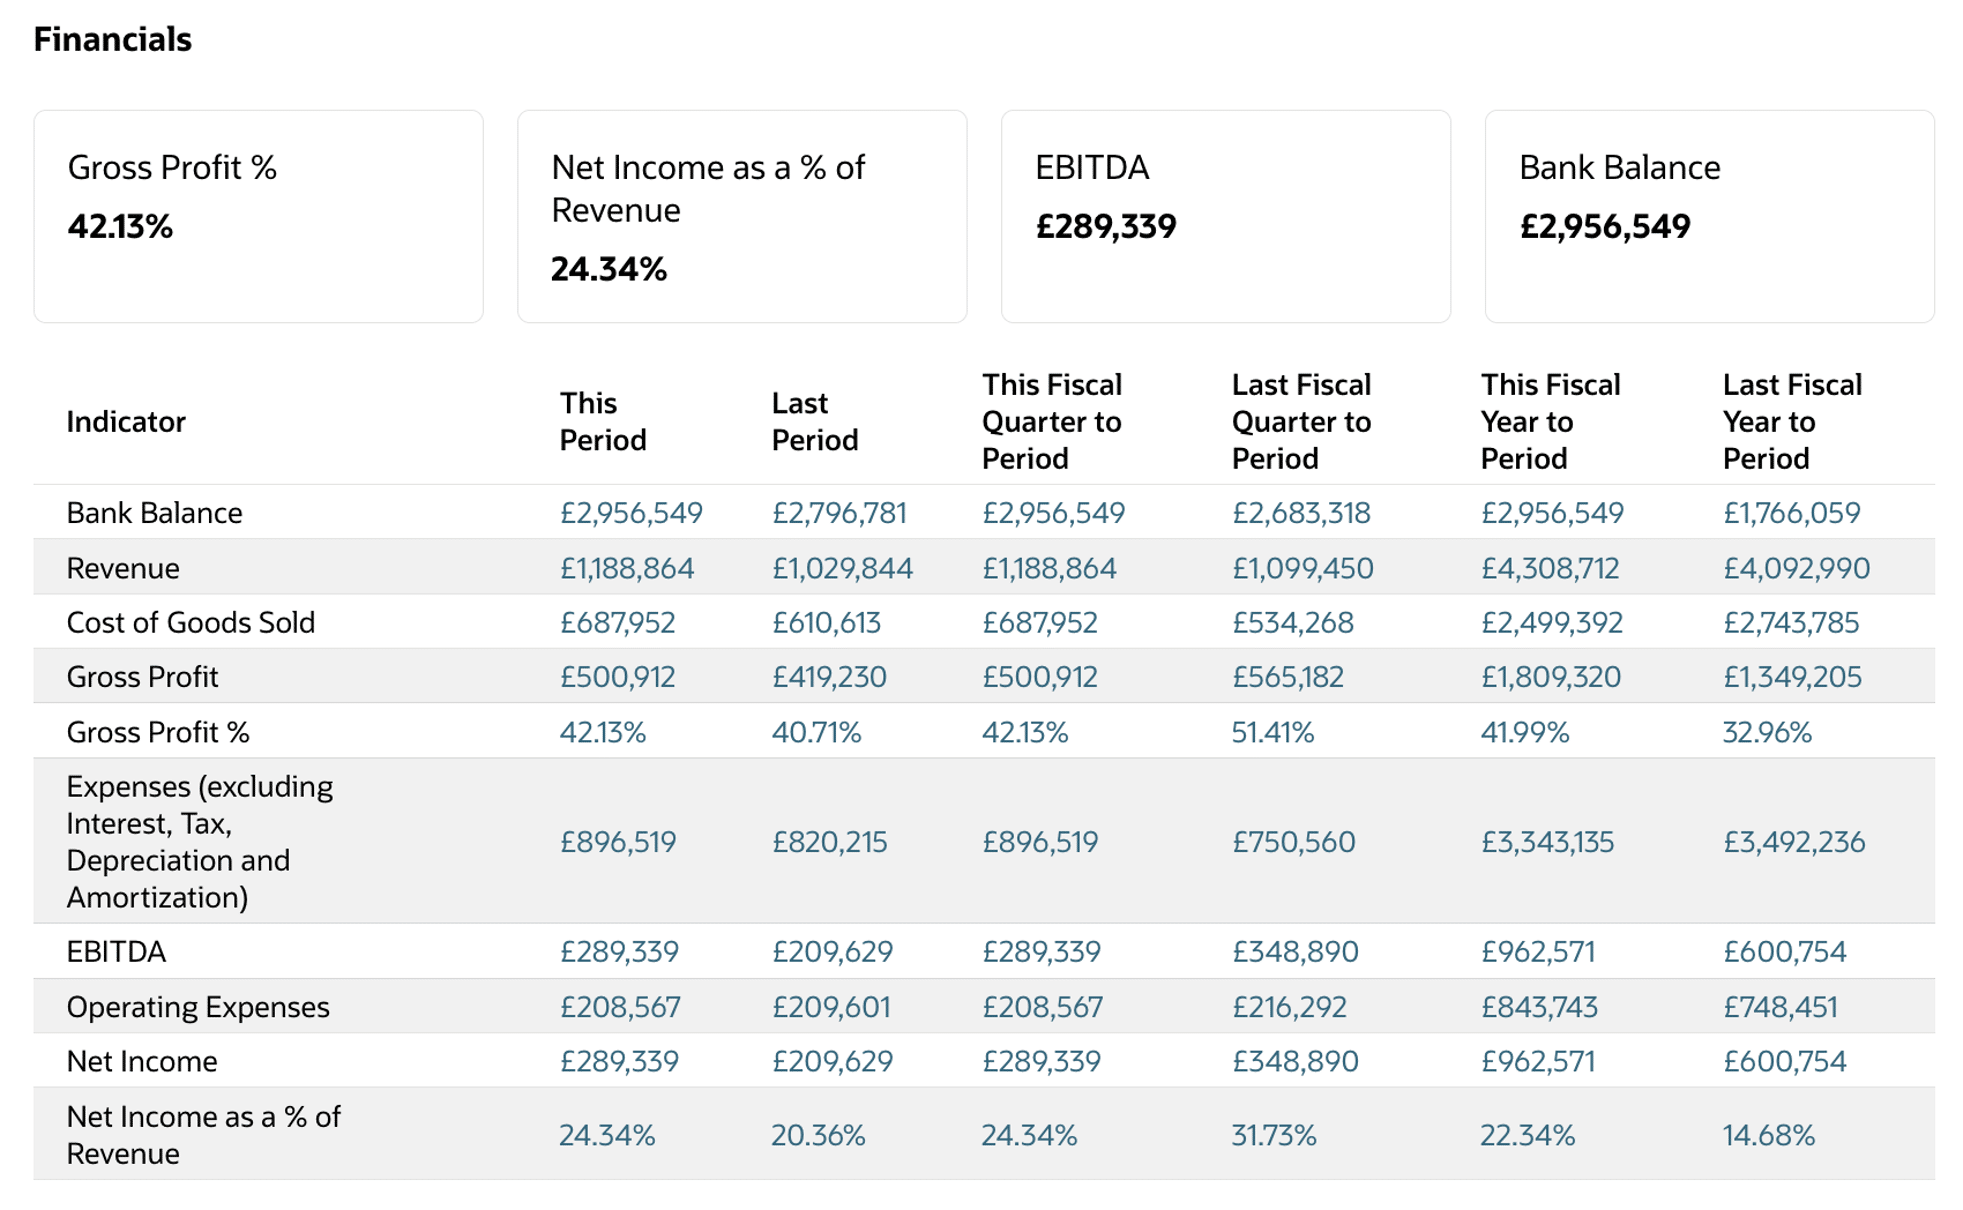
Financial Reports
NetSuite includes pre-built financial statements – such as Profit & Loss, Balance Sheet, Budget vs Actual, and Cash Flow – that you can customise to fit your business. For example, you might create:
- A detailed P&L for internal use with department-level granularity
- A simplified, statutory version for external stakeholders
- Multiple versions in different currencies for multinational teams

Matrix, Summary & Detailed Reports
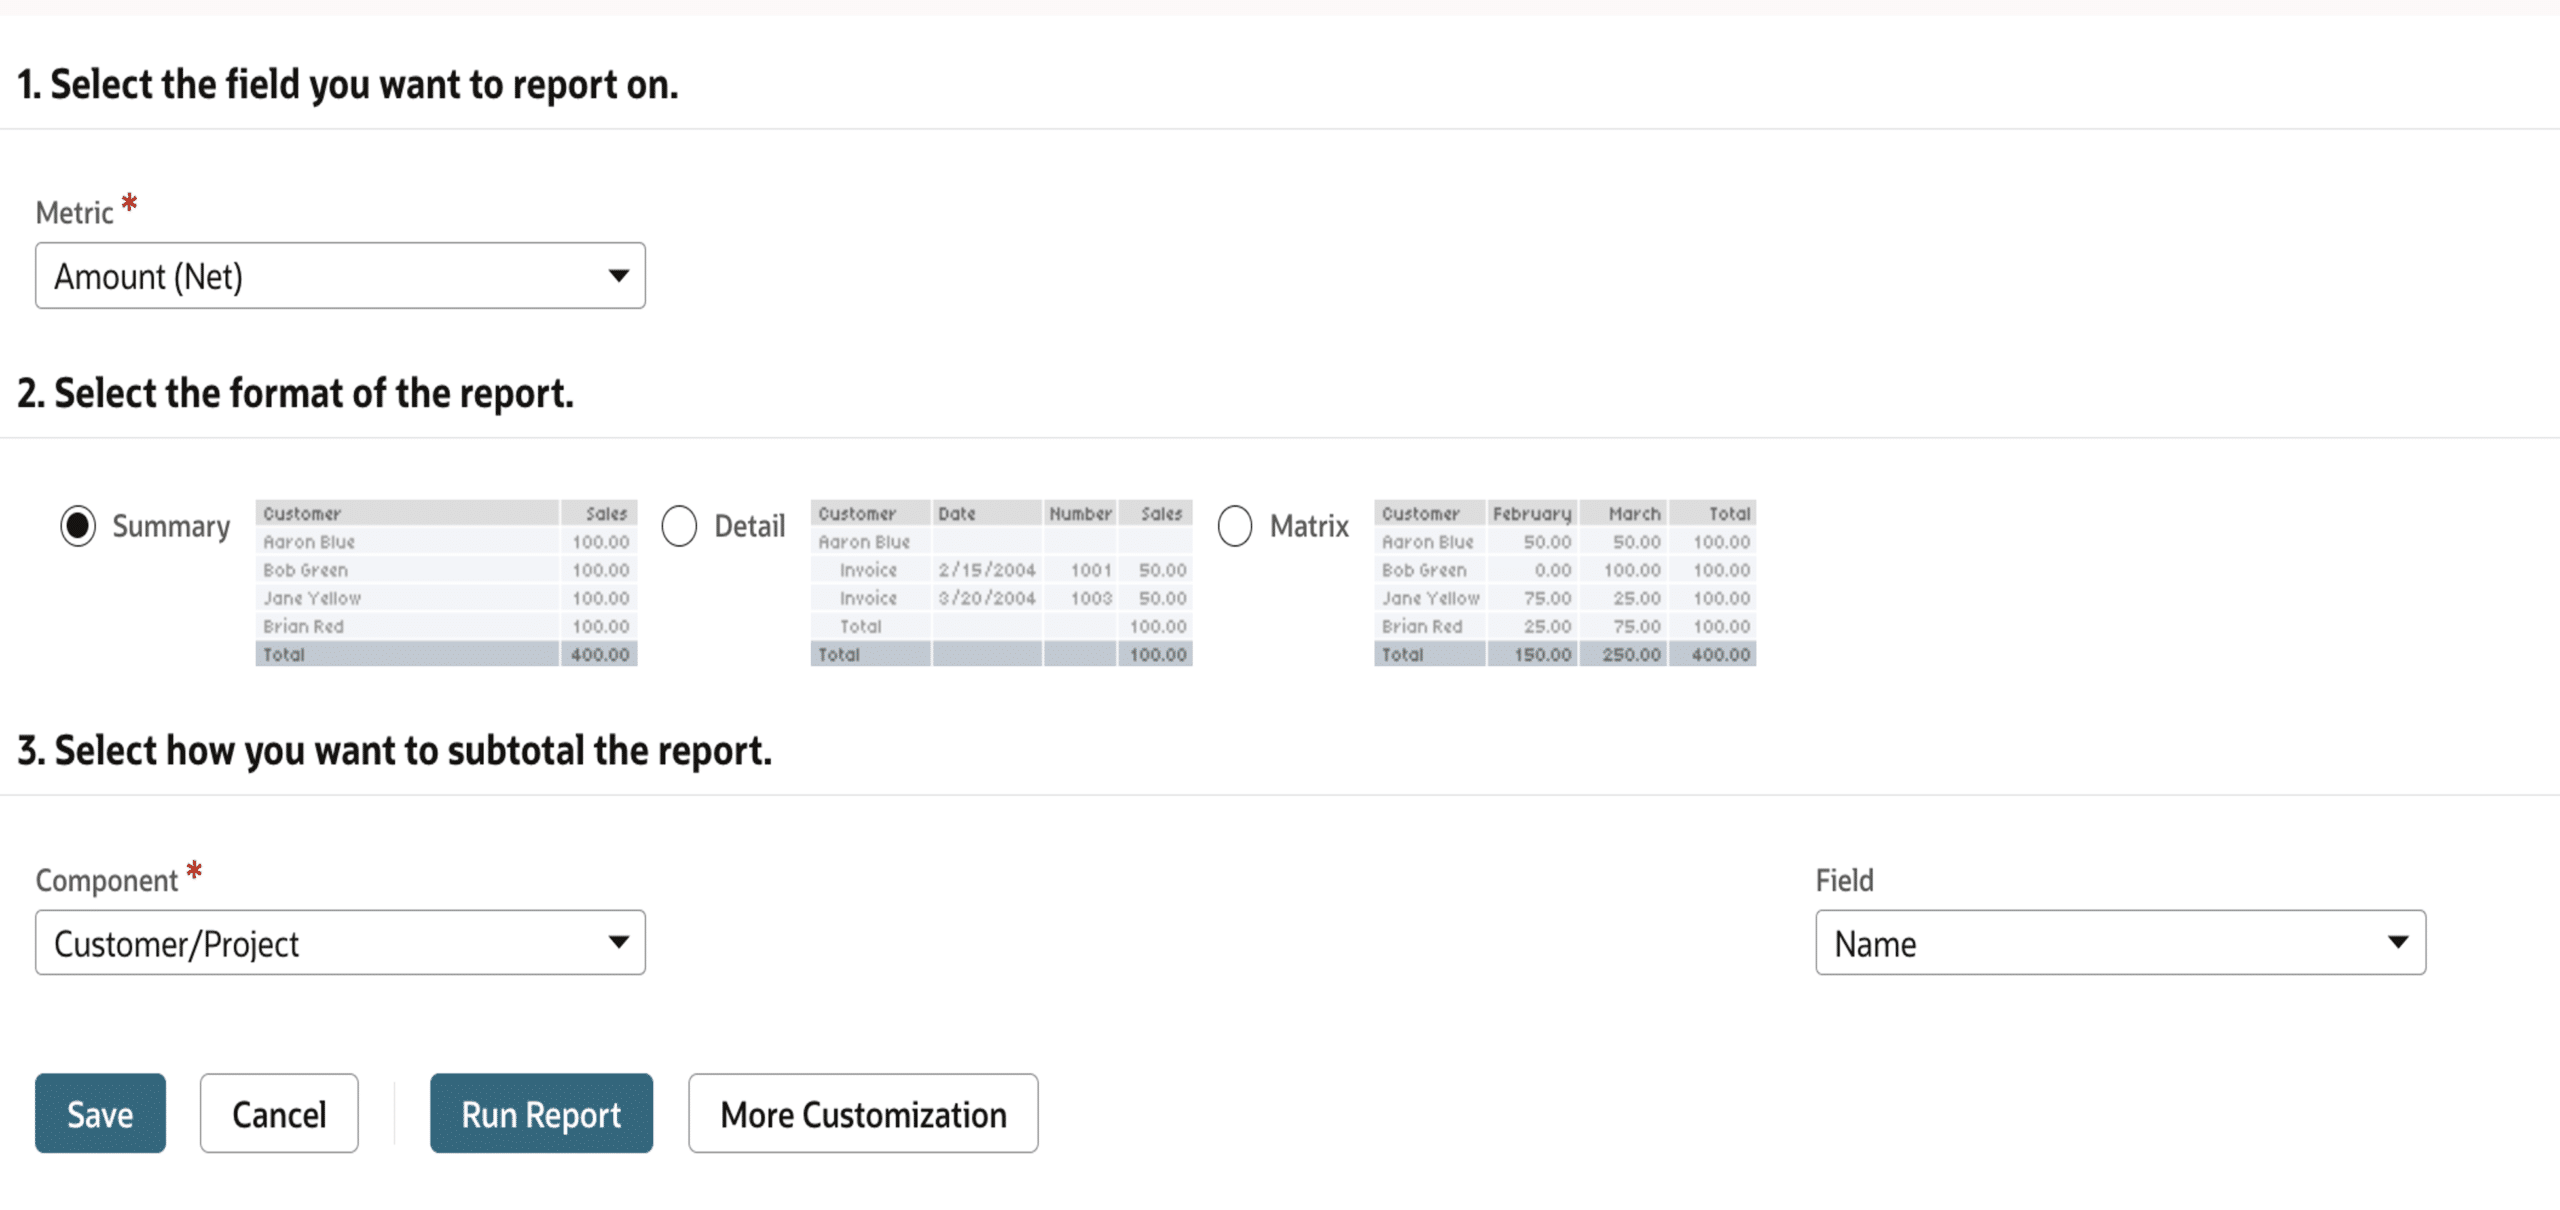
Use matrix reports to analyse performance across dimensions like class, location, or time period. Summary reports provide aggregated data, while detailed reports allow you to drill down to individual transactions.
A good use case: A CFO might use a matrix report to compare regional sales performance year-over-year, then drill into underperforming areas to investigate causes.
Multibook Reporting (OneWorld Only)
If your company operates under multiple accounting standards (e.g. IFRS, US GAAP), multibook reporting is a game-changer. It allows parallel reporting, providing the ability to record and report the same financial transaction in multiple ways, each according to a different accounting principle or requirement, without duplication of effort – a must-have for global finance teams.
Statistical Accounts
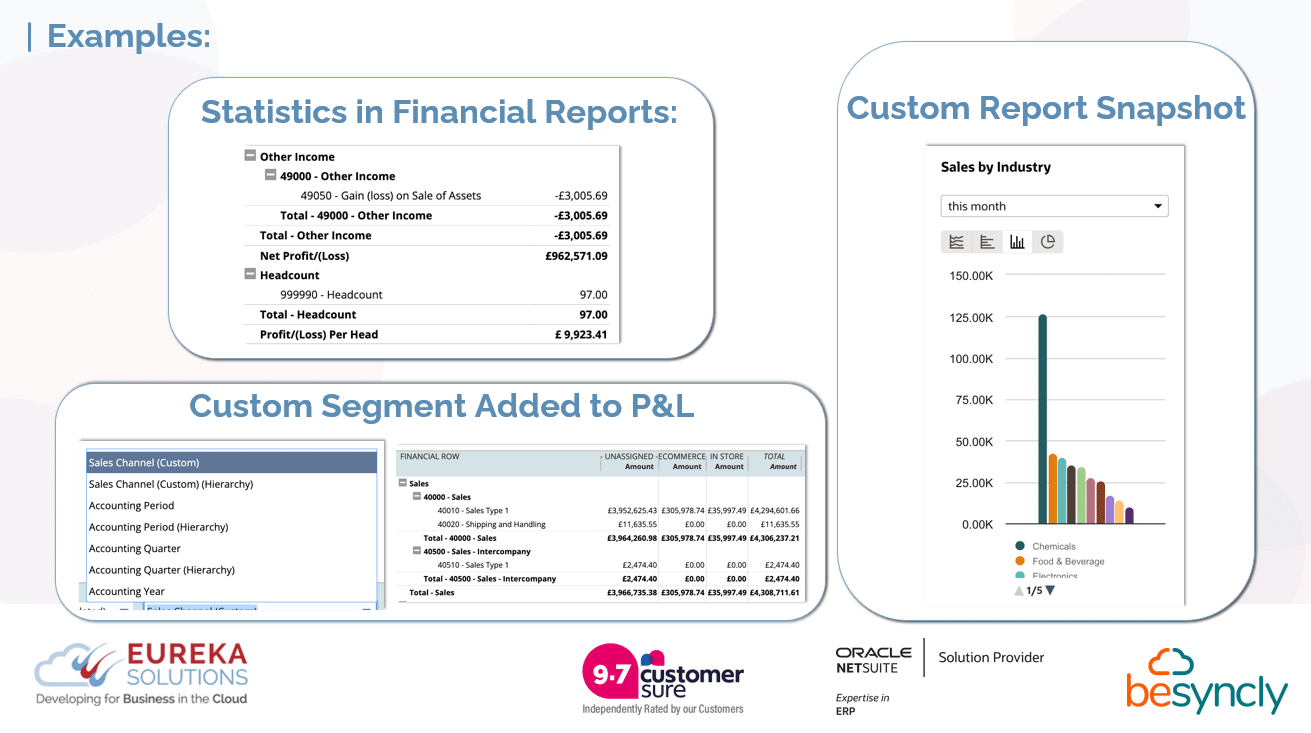
These accounts enable you to track non-financial metrics – such as headcount, square footage, or machine hours – and incorporate them into financial KPIs. For example, you might calculate revenue per employee or energy cost per unit produced.
Saved Searches:
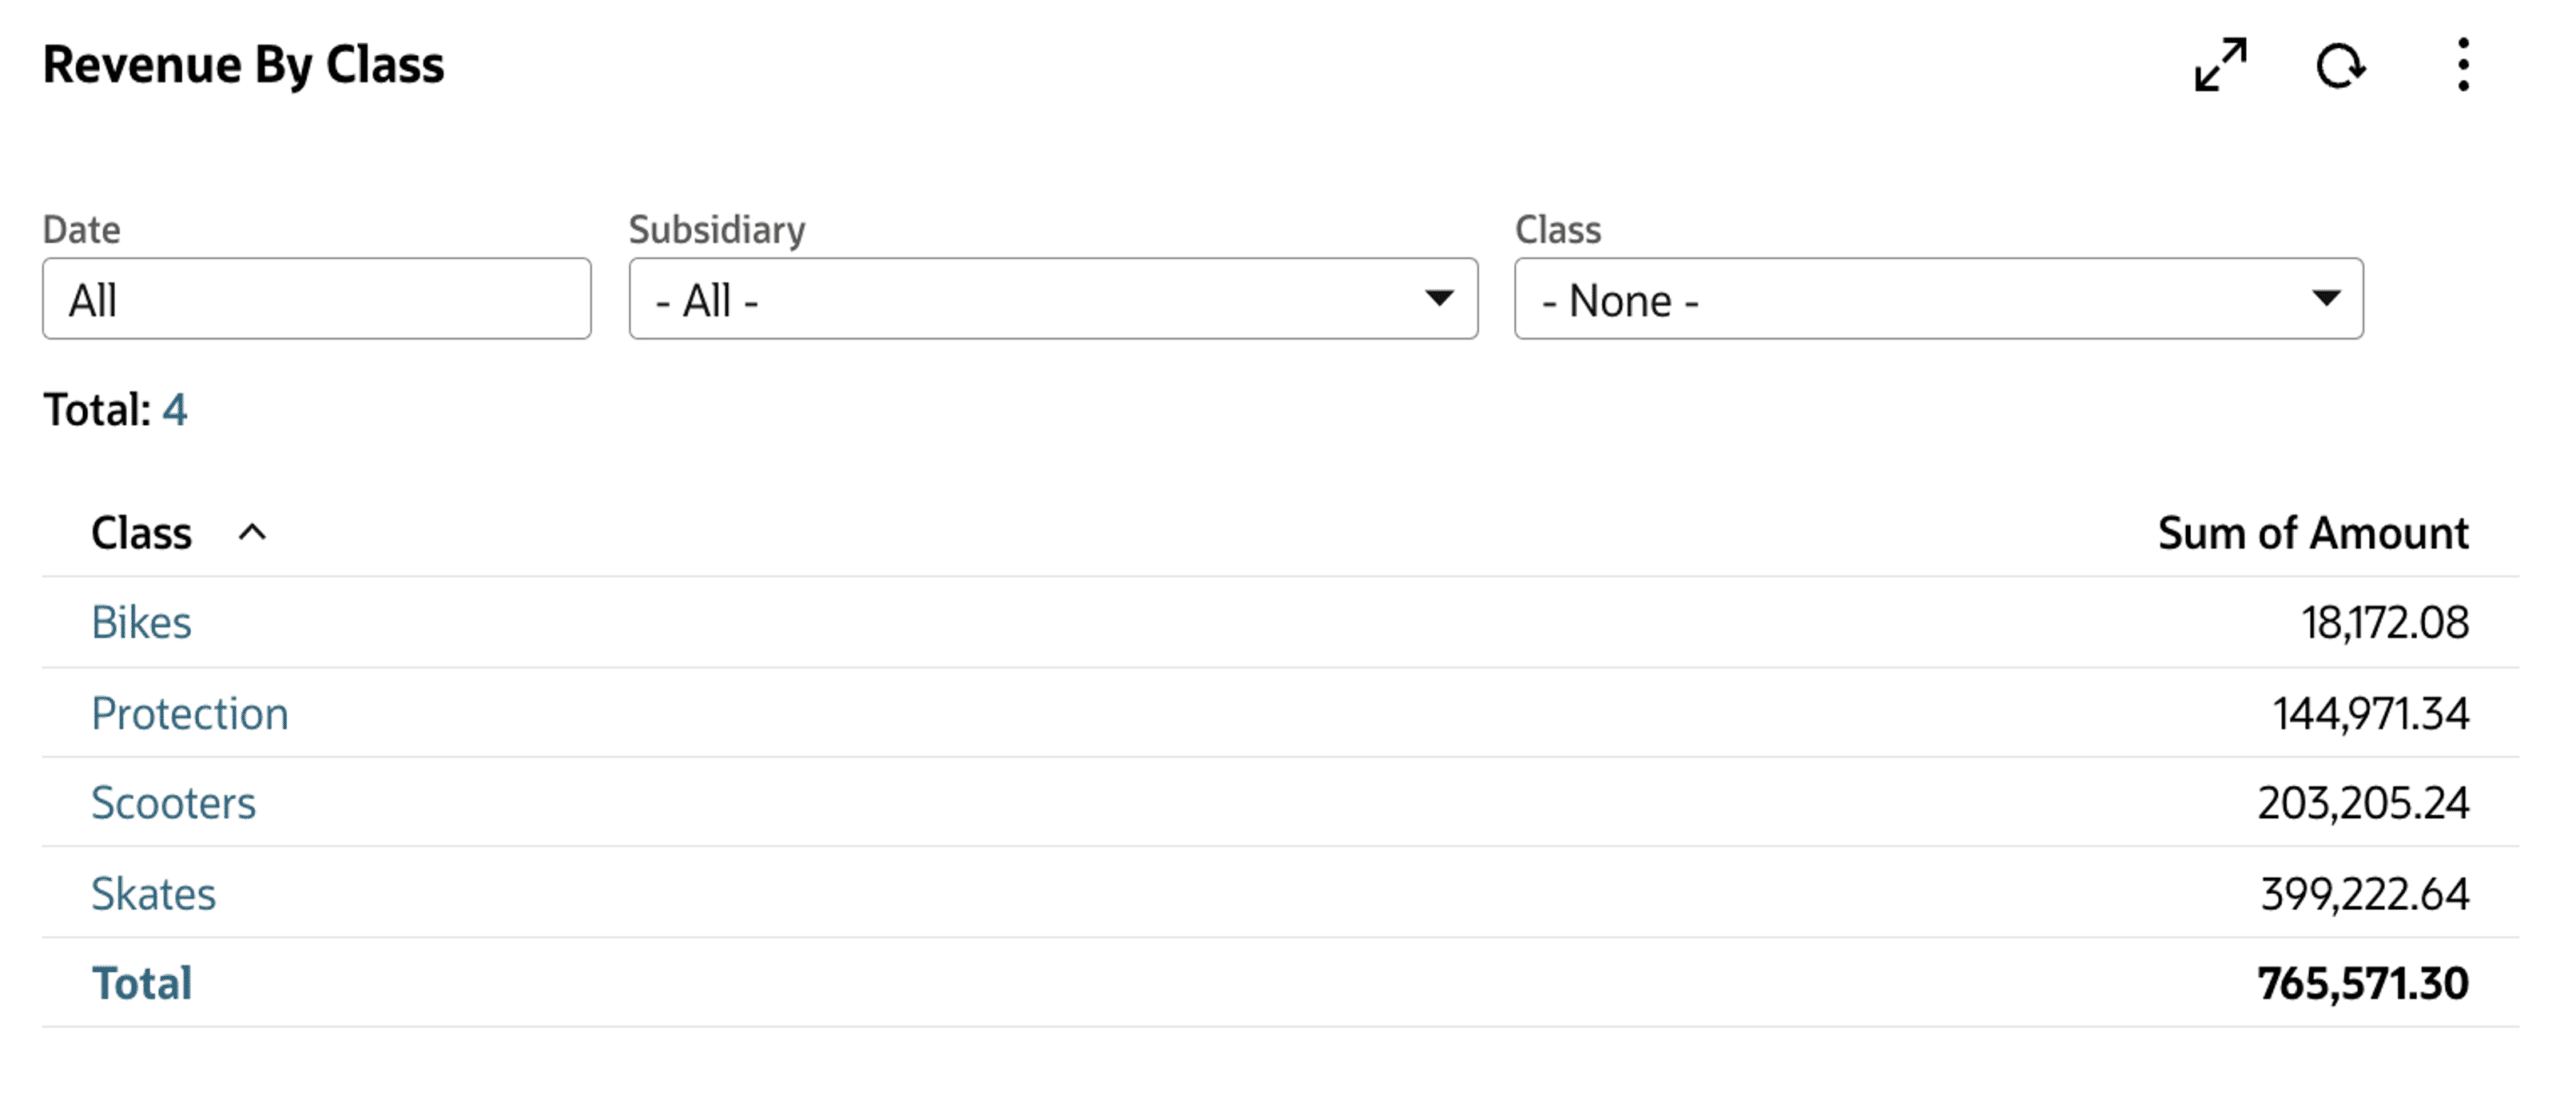
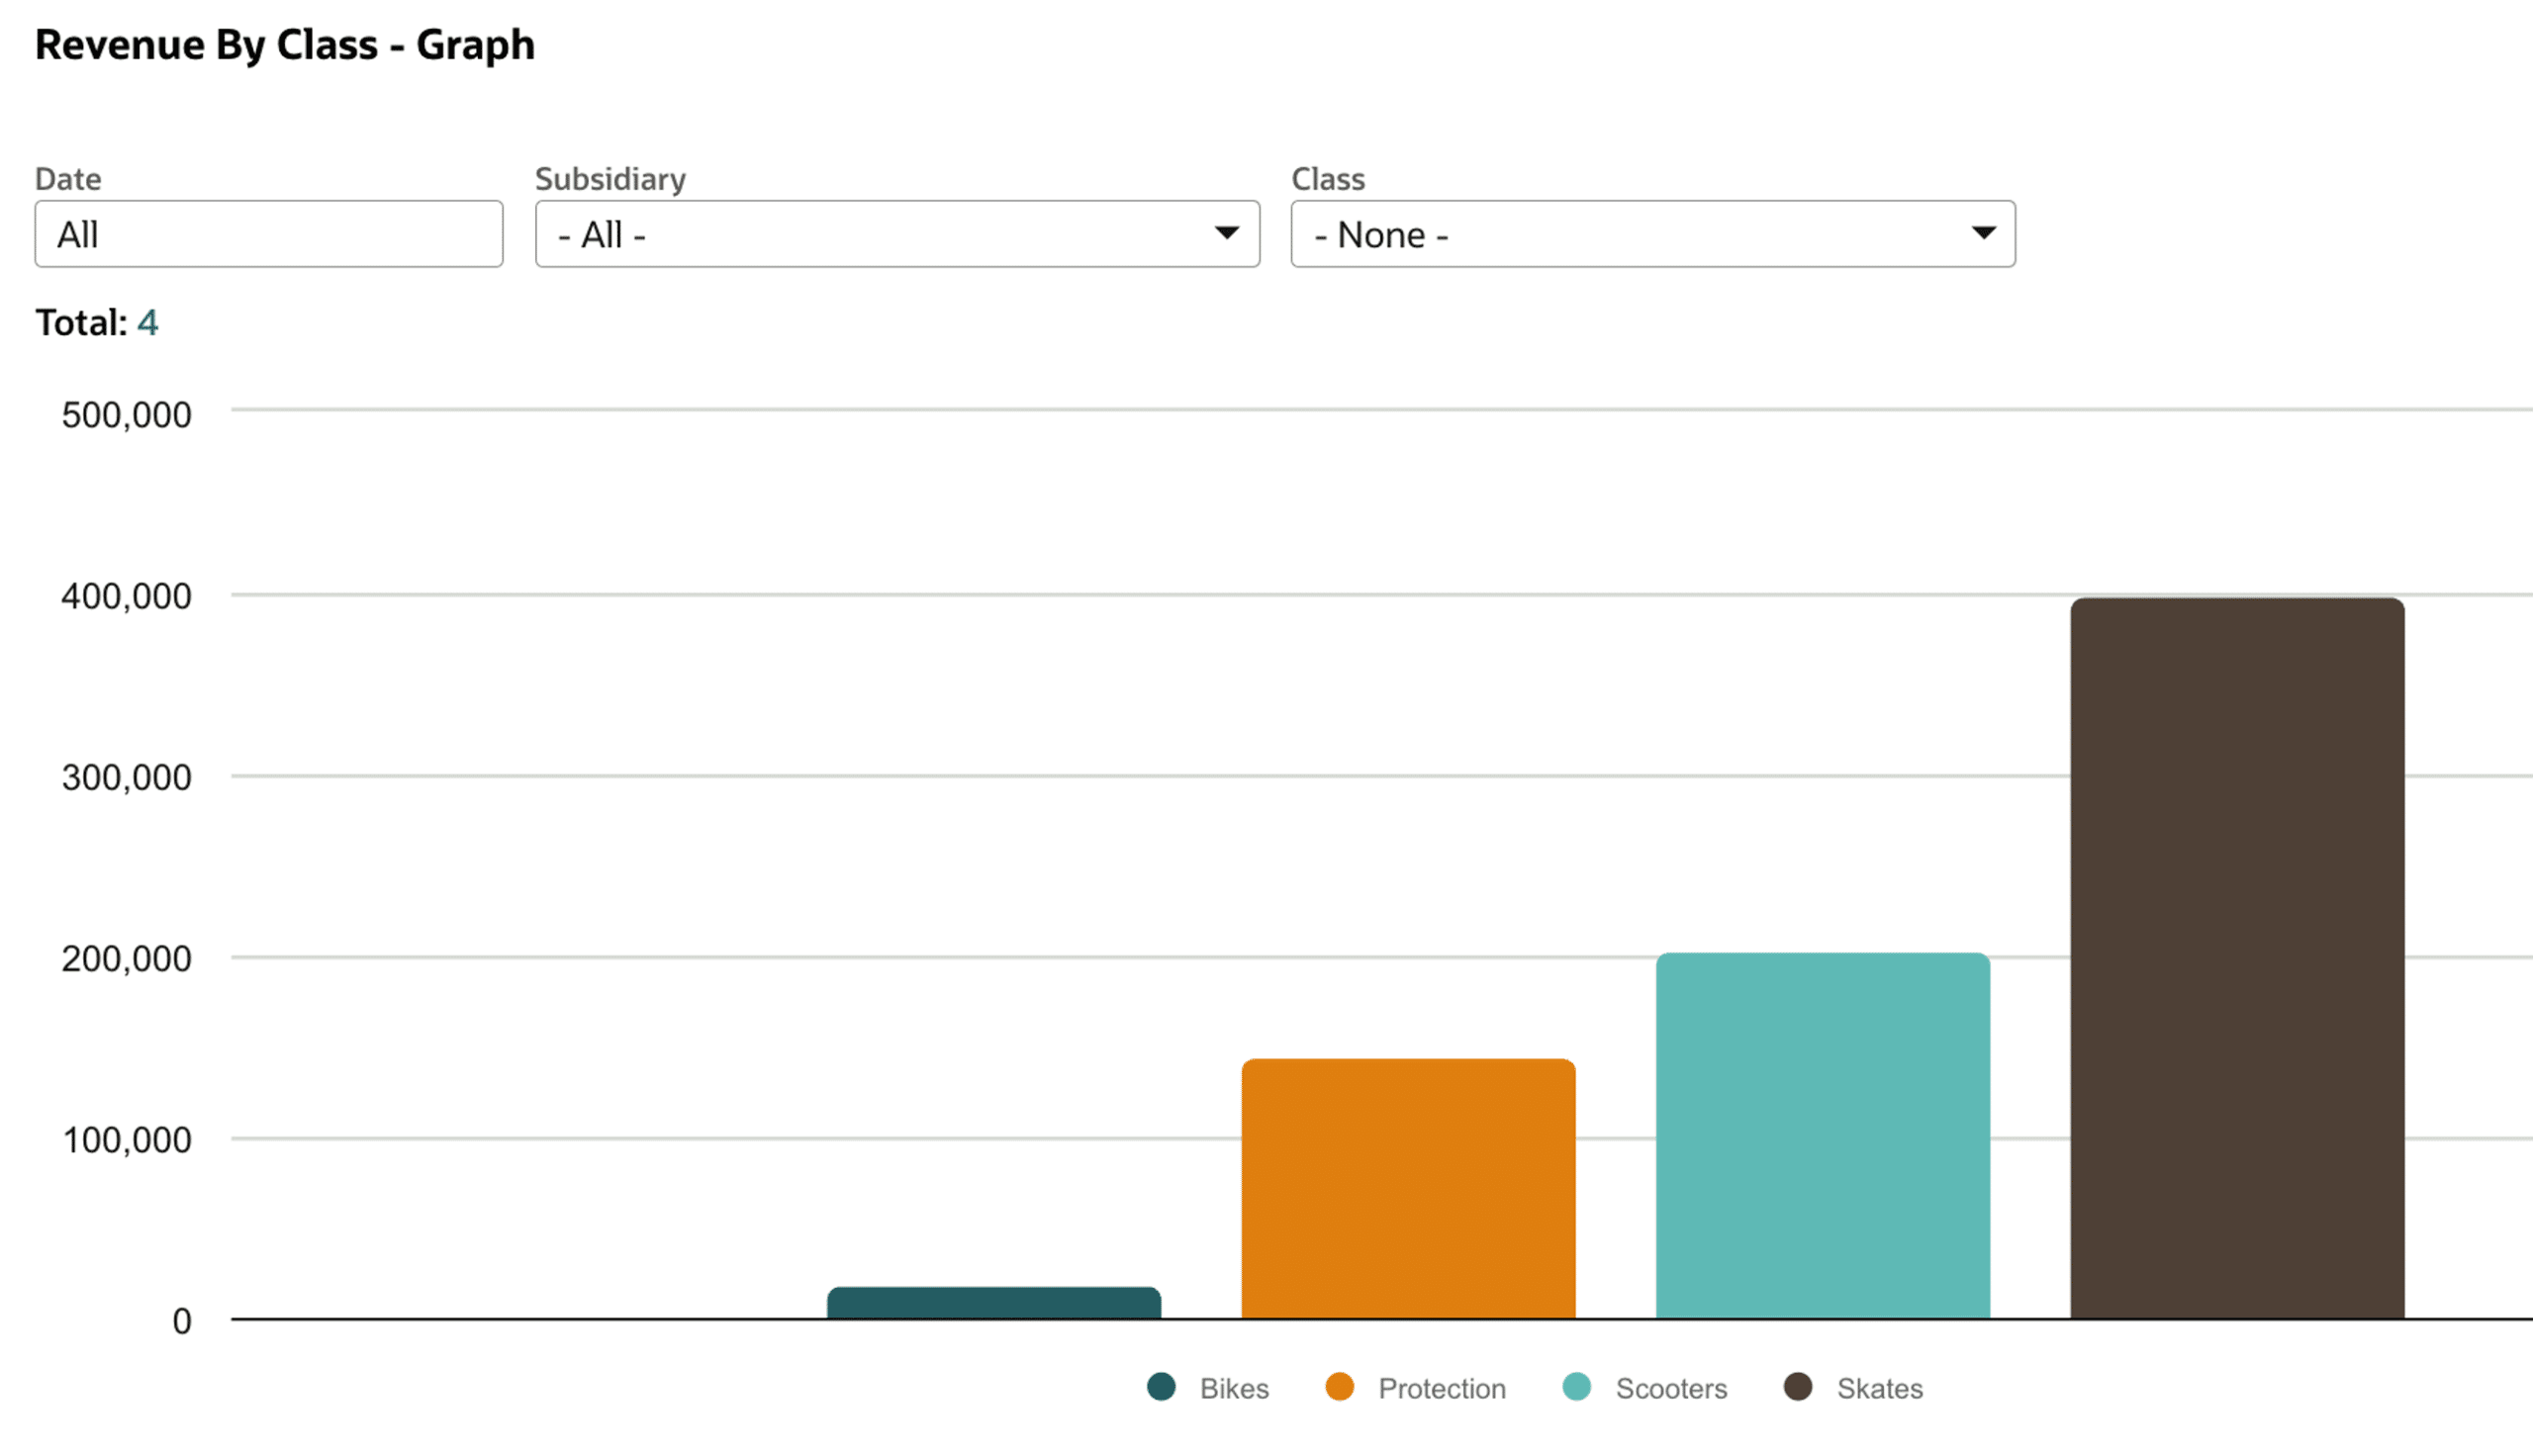
Saved Searches are a versatile and often underutilised reporting powerhouse. They’re more than just filtered lists – they’re a foundation for:
- Real-time dashboards
- Automated alerts (e.g. overdue invoices)
- Scheduled reports delivered via email
- Data exports and summaries
You can even build conditional logic and formulas into your Saved Searches. For instance, you might highlight deals closing this week in green and overdue leads in red. They’re also a great way to build audit trails or power exception reporting, such as finding transactions missing a required field.
Scorecards
Scorecards let you monitor KPIs over time, using rolling periods, custom ratios, and historical comparisons. This is especially useful for performance reviews, revenue growth tracking, or monthly board meetings.
Advanced Reporting Options
As your data requirements evolve, so too does the range of advanced modules available within the Oracle ecosystem.
SuiteAnalytics Connect (ODBC)
ODBC (Open Database Connectivity) gives you read-only access to NetSuite data from external platforms like Power BI, Tableau, SQL Server, or Excel. It’s perfect for:
- Building board packs in Excel with live NetSuite data
- Creating backup extracts for compliance
- Sharing reports with auditors or external stakeholders
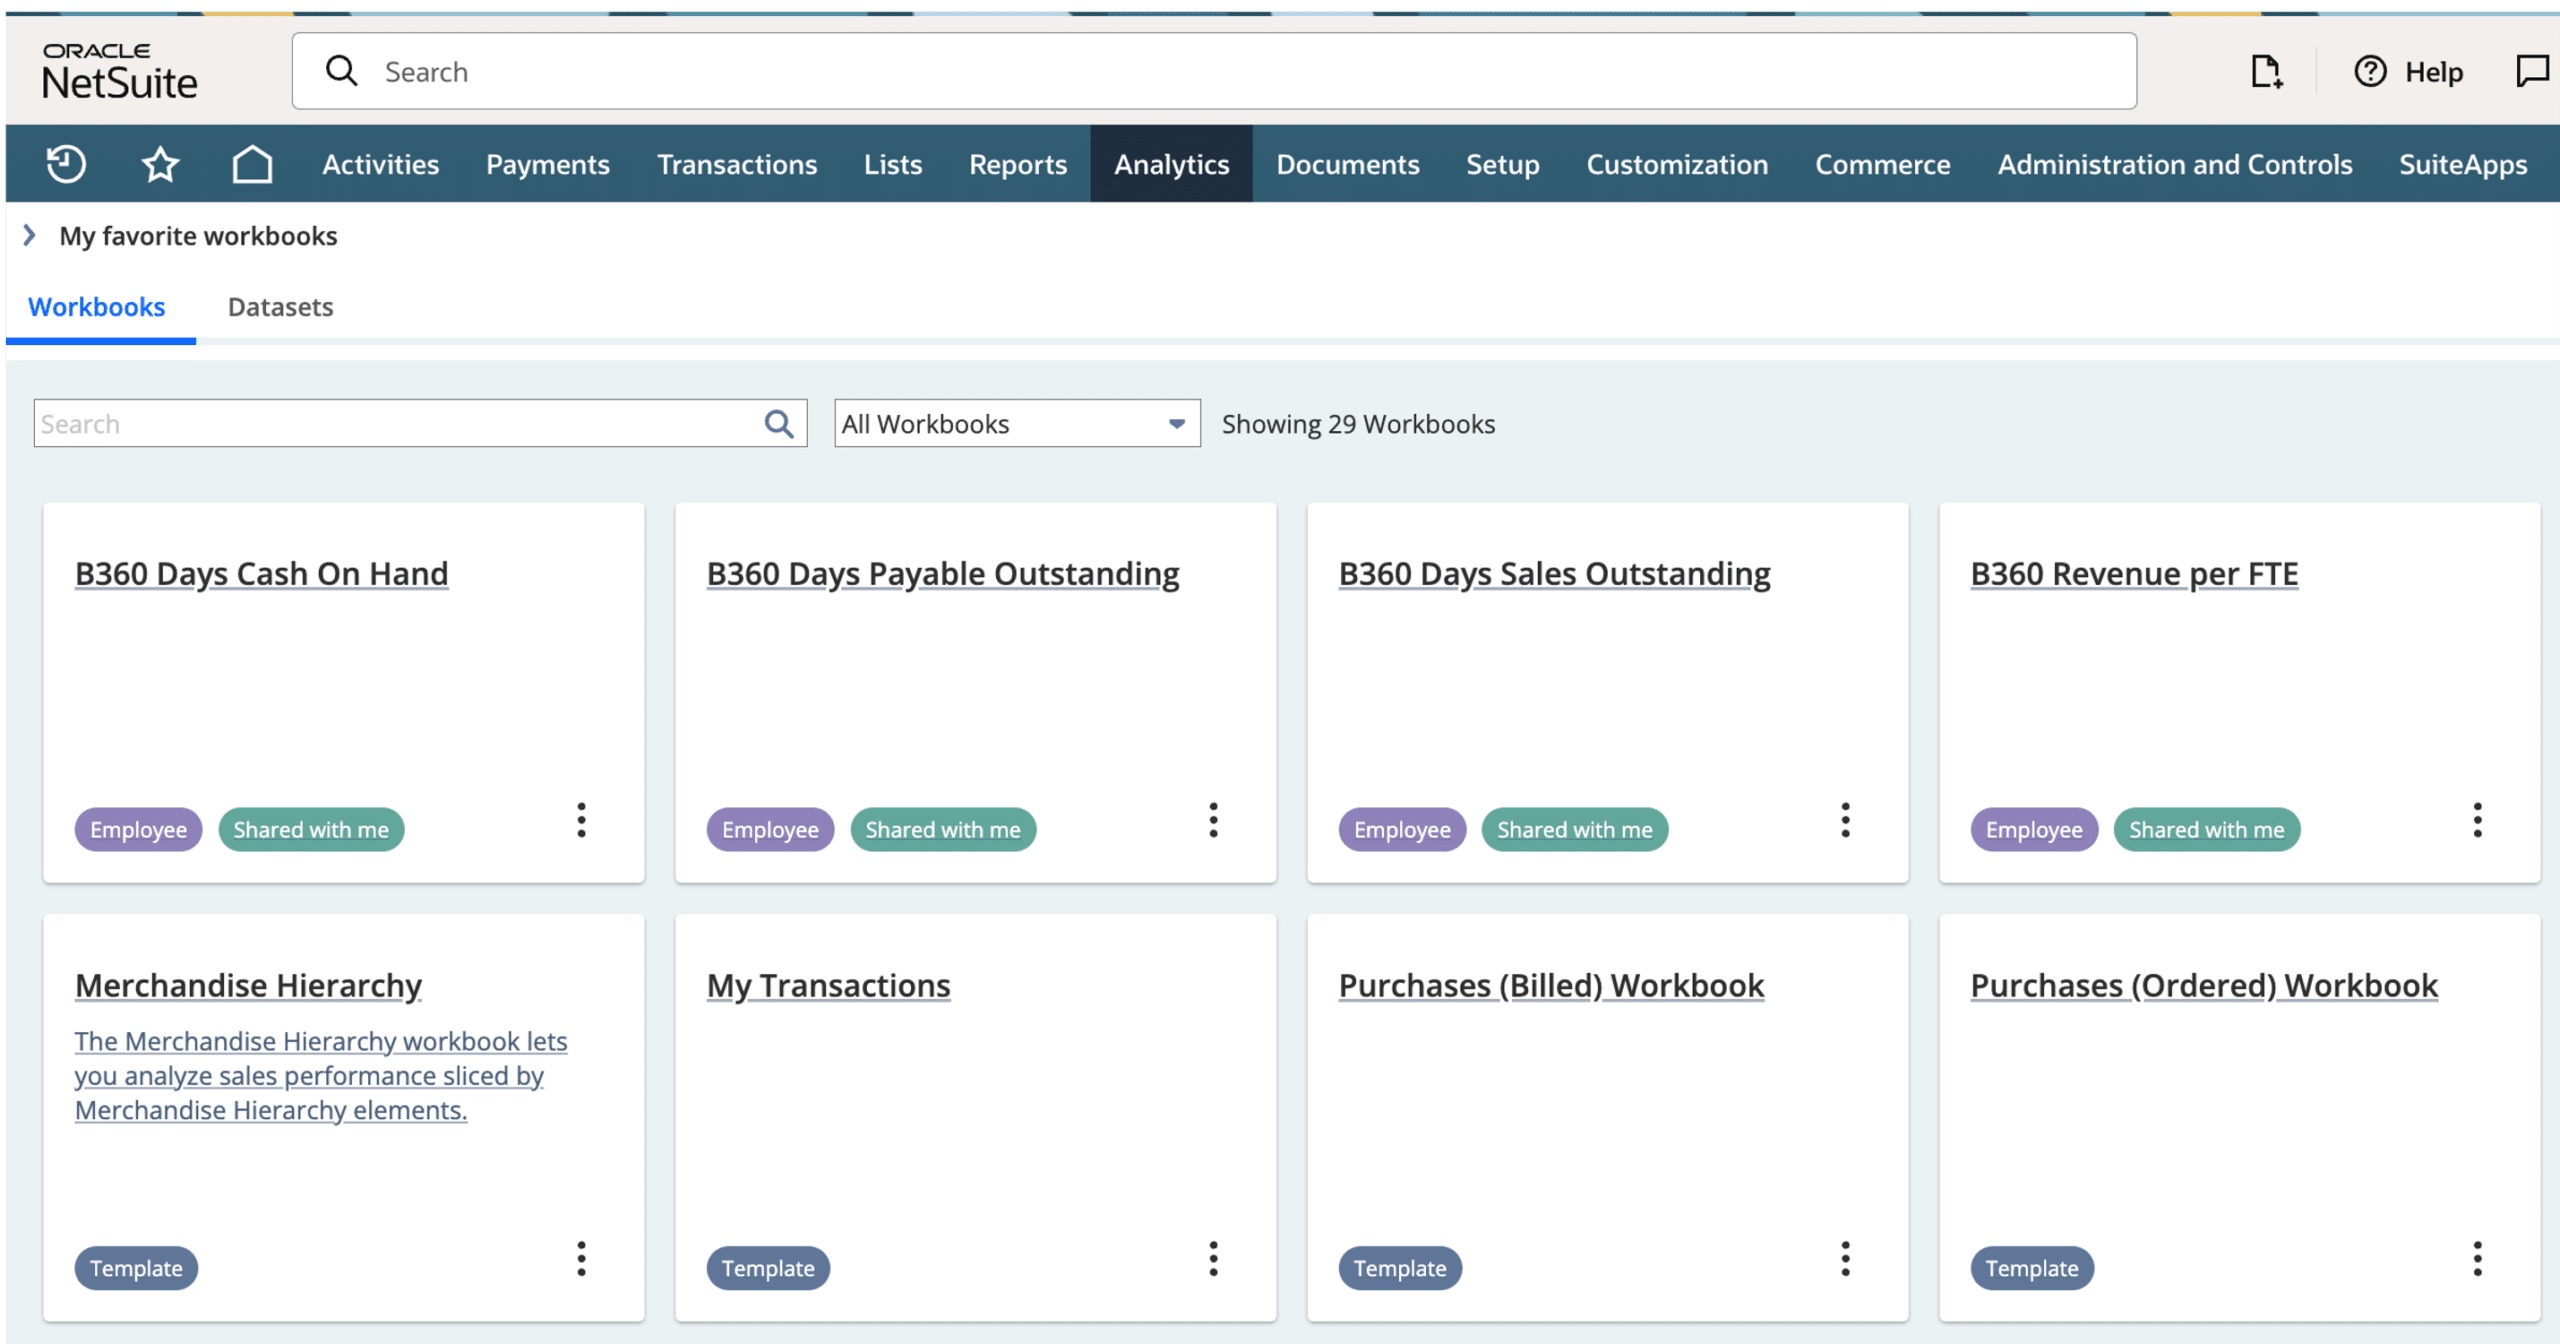
SuiteAnalytics Workbooks
Workbooks provide a more modern, interactive reporting experience. With drag-and-drop tools and pivot-style analysis, they’re ideal for users who want deeper insights without relying on IT or external tools.
Key benefits:
- Combine multiple data sets
- Create custom charts and visualisations
- Embed reports into dashboards
- Share insights securely across teams
For example, marketing can analyse campaign ROI, while finance can build a profitability analysis across products and time periods.

NetSuite Analytics Warehouse (NSAW)
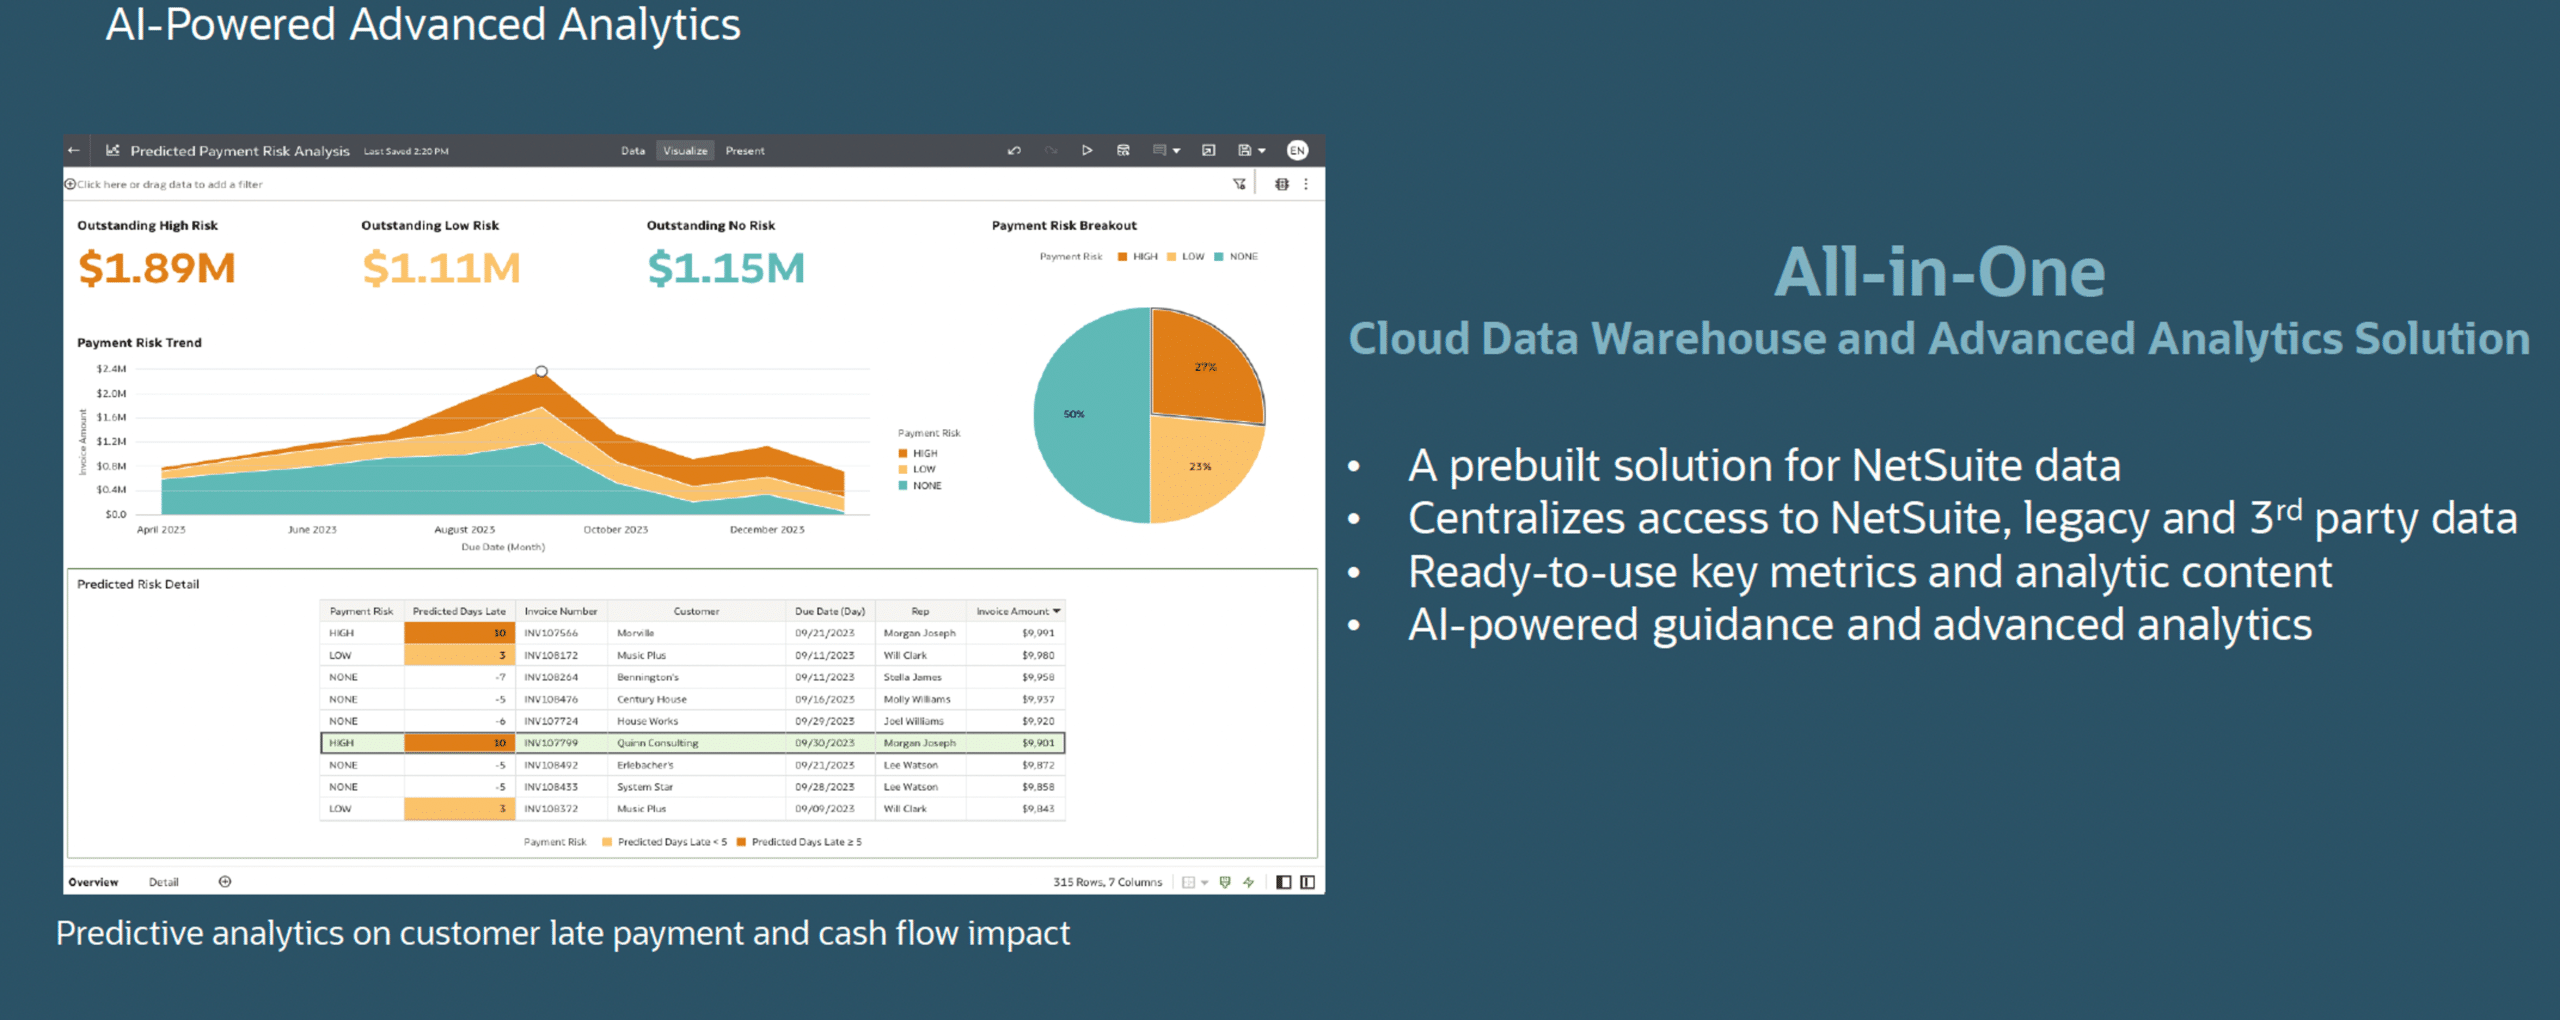
NSAW is a cloud-based business intelligence and data warehousing solution that enables deeper analysis, advanced visualisations, and AI-driven insights – not just from NetSuite, but from multiple data sources across your organisation (e.g. Salesforce, Google Ads).
It includes:
- AI-driven insights and predictive analytics
- Pre-built dashboards for NetSuite modules
- Cross-platform data consolidation (e.g. merging CRM and ERP data)
Use it to forecast customer churn, model revenue, or analyse historical trends – all with Oracle-grade security and performance.
Enterprise Performance Management (EPM)
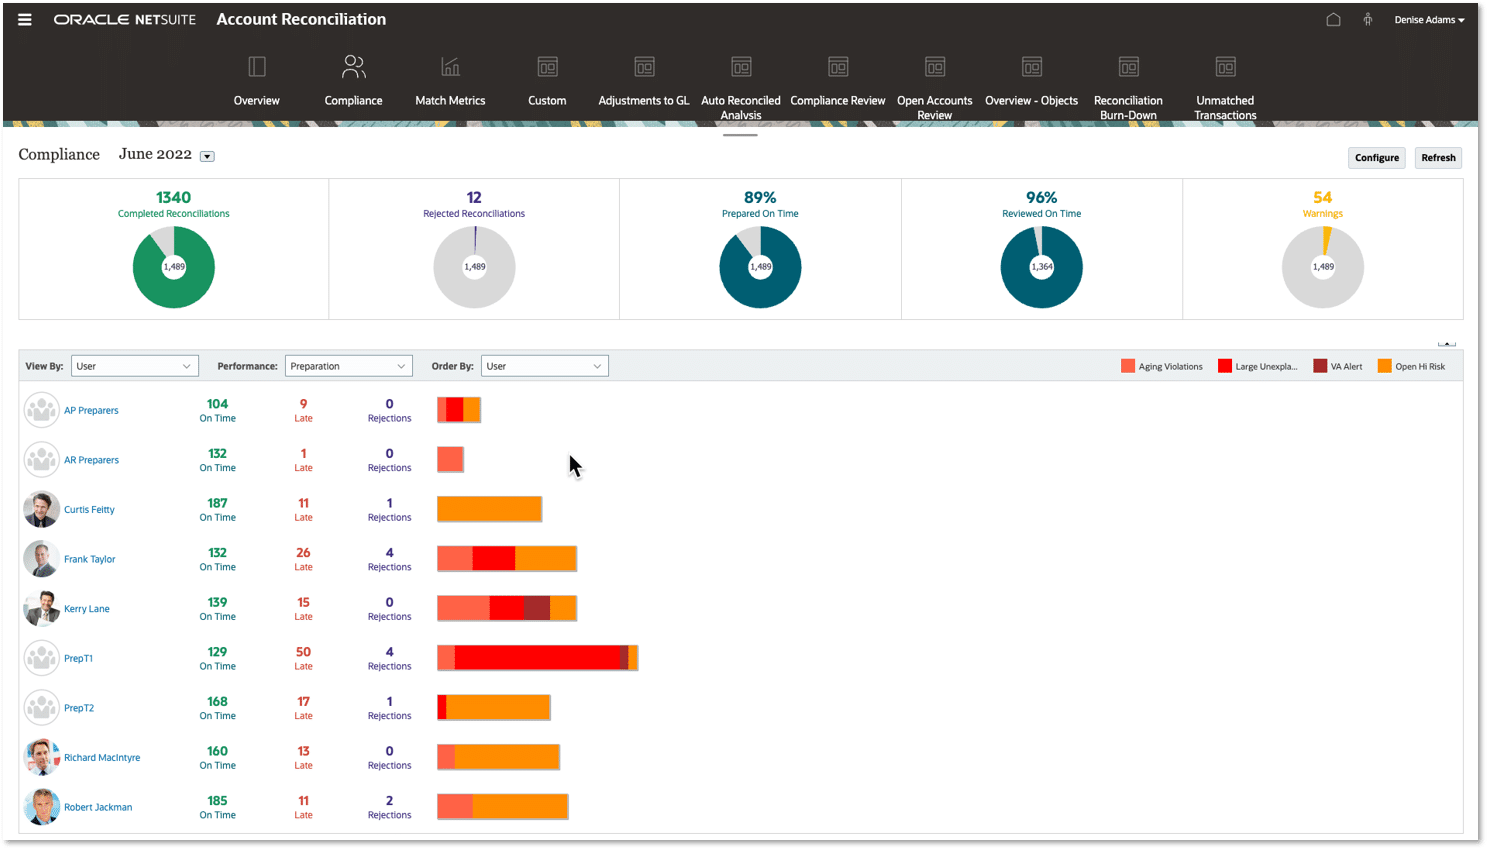
EPM tools help you manage your financial planning and close processes in a single platform. Key modules include:
- NetSuite Planning and Budgeting (NSPB) – Replaces Excel-based planning with centralised collaboration and AI-driven forecasting.
- Account Reconciliation – Streamlines the month-end close and reduces manual errors.
These tools offer natural language summaries, predictive modelling, and customisable workflows.
Third-Party Reporting Tools
When native tools aren’t quite enough, the NetSuite ecosystem offers powerful integrations:
Solution 7 – A NetSuite SuiteApp that provides two-way integration between NetSuite and Excel, helping you create flexible budgeting and forecasting models that can be personalised for each individual budget holder, emailed and quickly loaded into NetSuite with just a few simple clicks.
ZoneReporting – Built on Power BI, with plug-and-play, customisable dashboards and visualisations, providing real-time insights into various business operations, including finance, sales, operations, and supply chain management.
Tactical Connect – Data connector for external reporting tools/data extract, which doesn’t require ODBC.
These options can extend reporting to meet very specific or niche business requirements – particularly for enterprise-scale environments or teams with established tool preferences.
Training & Support Resources
No matter your reporting goals, there’s help available:
- Learning Cloud Support Pass (LCSP) – On-demand training modules for all levels.
- NetSuite Help Center – In-depth documentation and how-to guides.
- Customised Training – Work directly with Eureka Solutions to build dashboards and reports tailored to your business.
With NetSuite’s comprehensive reporting toolkit, you’re never more than a few clicks away from real-time insights. Whether you’re managing daily operations or forecasting for the year ahead, having the right data at your fingertips is a competitive advantage.
From the basics like financial reports and Saved Searches to cutting-edge tools like NSAW and EPM, there’s a reporting path for every business and every user.
For a deeper dive into everything we’ve covered, be sure to watch the full webinar.
Additionally, if you have any questions or would like guidance tailored to your business’ reporting needs, feel free to get in touch – we’re here to help.
